Green Tea Imports: Insights on Volume, Value, and Transport Mode
.webp)
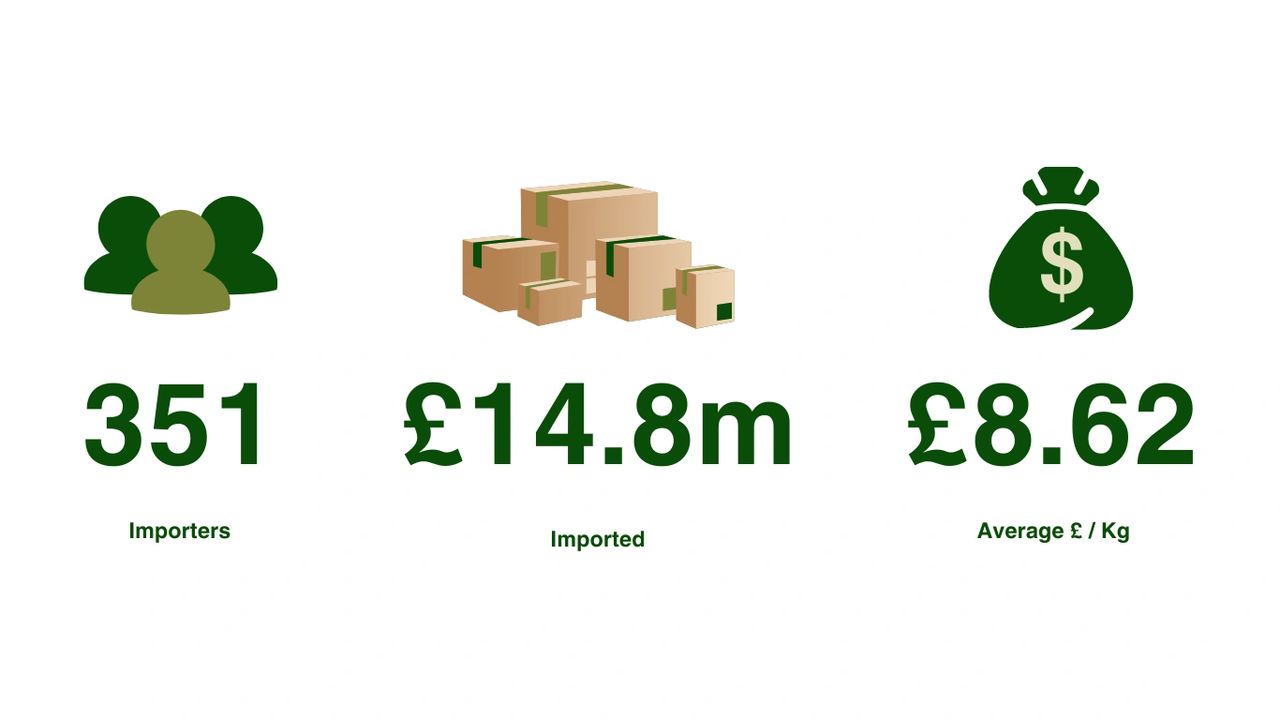
Globally Green Tea represented 33% of all tea consumption in 2022, so it’s no wonder that £14.8m worth was imported into the UK in the first half of this year. For the 351 businesses that imported this tea, understanding transport routes and how to optimise effectively is critical to stay competitive.
Seasonality & Value fluctuations
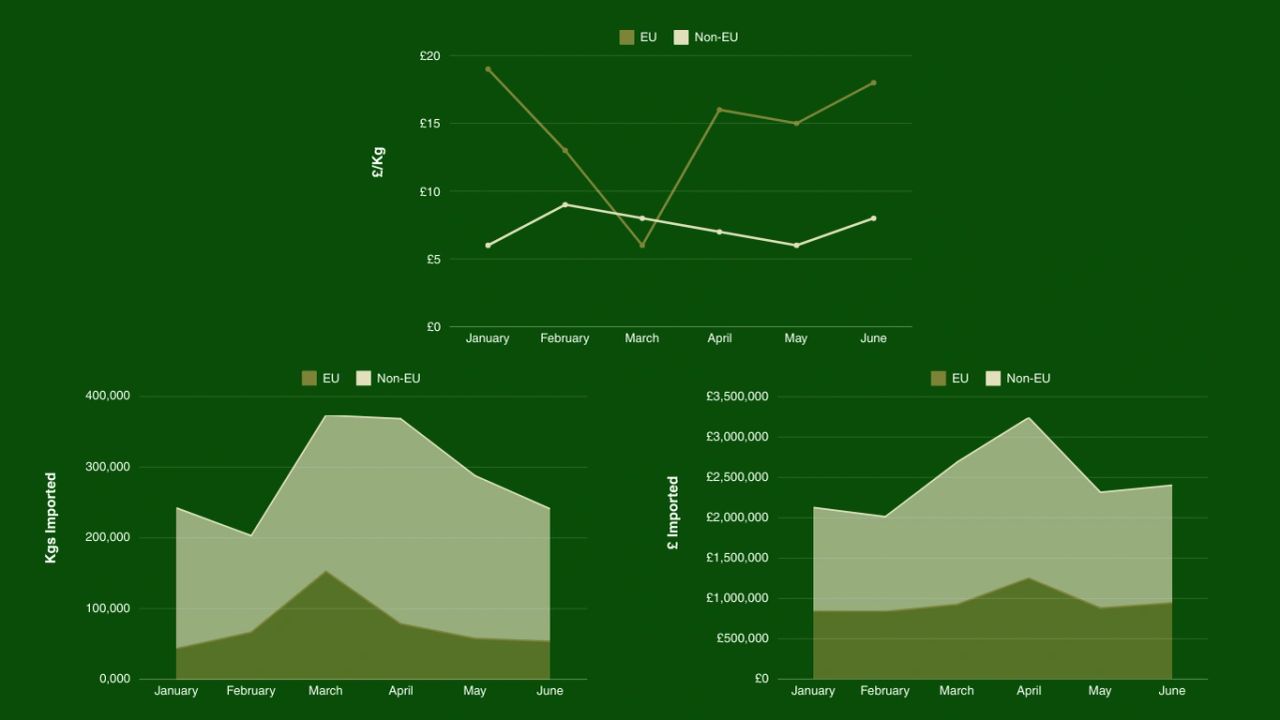
In the first half of this year (January to July), the UK imported approximately 1.7 million kilograms of green tea, valued at £14.8 million. Imports did fluctuate month on month, with March and April seeing the highest amount imported. Interestingly, despite both months being very similar in terms of quantity imported, the value of the tea imported in March was overall lower than that in April. You can see that the average cost per kg for tea imported from the EU did drop significantly in March compared to the other months.
EU vs Non-EU
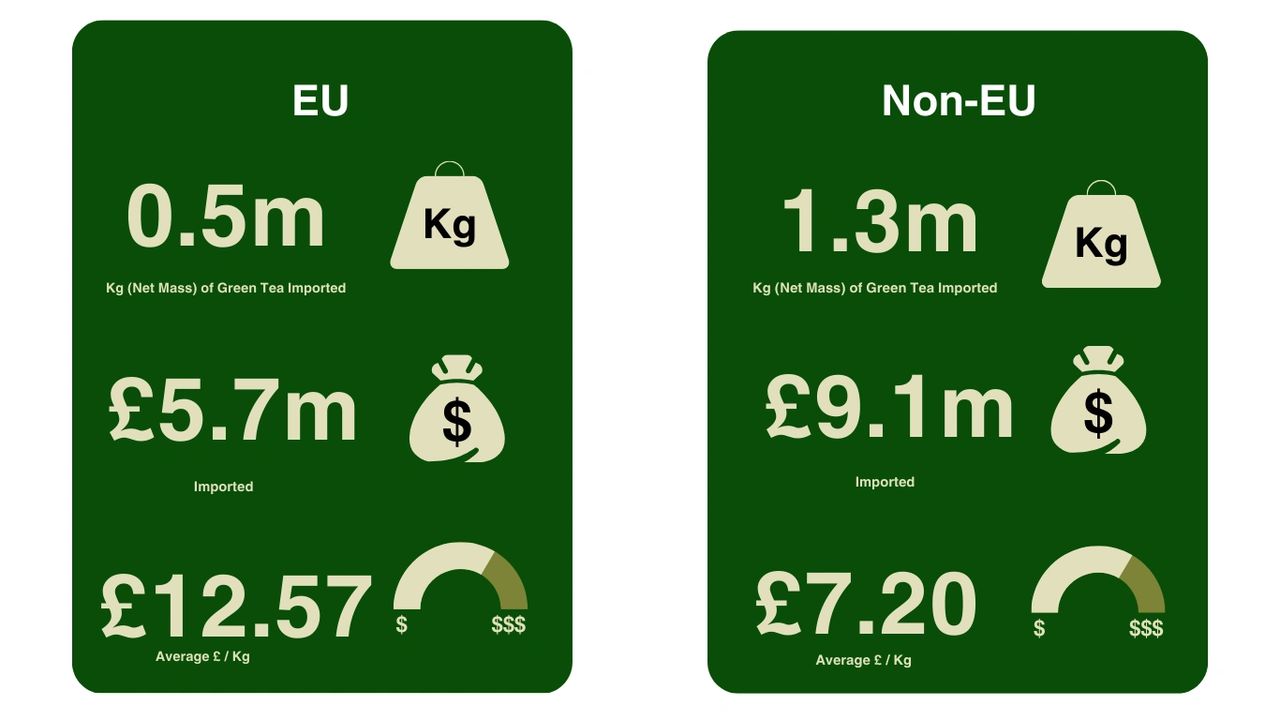
EU: The UK imported 0.5 million kilograms of green tea from EU countries, totalling £5.7 million, which translates to an average price of £12.57 per kilogram. It's worth noting that these figures represent the location of import rather than the tea's origin. For example, green tea taking a route via a European country before travelling to the UK likely to be cast as an EU import, despite the tea being originally sourced from elsewhere, such as Asia.
Non-EU: Non-EU countries contributed 1.3 million kilograms, valued at £9.1 million, bringing the average price to £7.20 per kilogram. Direct imports from source countries—primarily in Asia—tend to come at a lower cost. The lower price points suggest the bulk of these imports arrive via sea freight rather than air as it is generally cheaper.
Port arrivals
Effective port management is vital for streamlined operations in the tea import business. The following UK ports have emerged as key entry points for green tea.
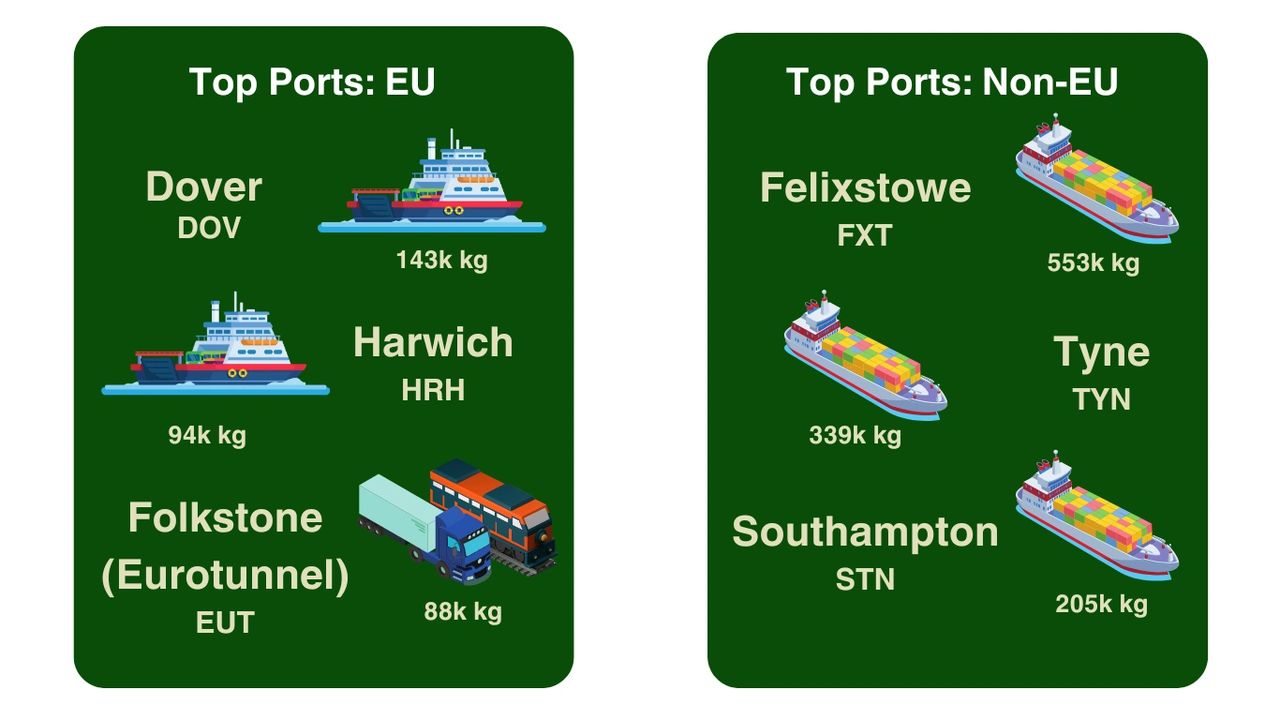
While it cannot be stated with complete certainty, EU imports often appear to favour ports specialising in RoRo (Roll-on/Roll-off) or truck/train transport over those focused on container or bulk shipments. Each port has been assigned a likely transport mode based on freight statistics, which indicate the types of vessels that arrived there in the past year. A comprehensive list of ports and their corresponding transport modes can be found here. This trend raises intriguing questions about the factors influencing these choices, as certain routes may offer varying trade-offs in terms of cost, speed, and security.
Modes & Value
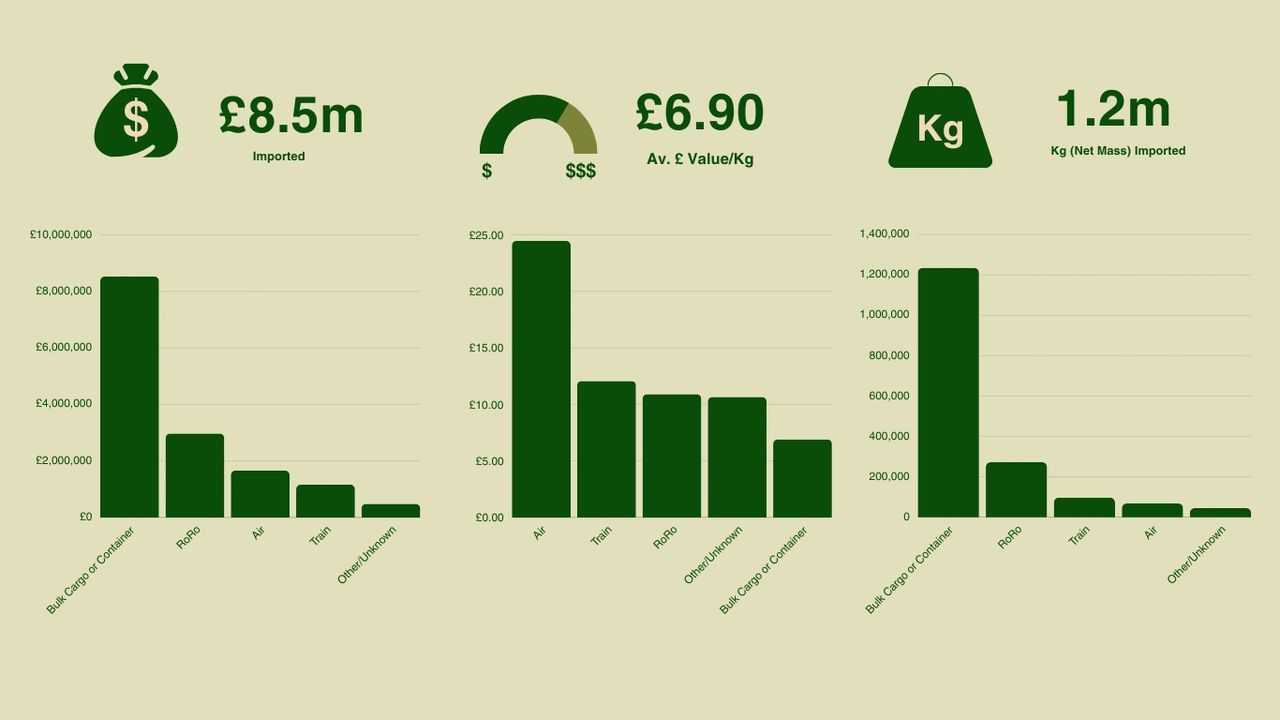
Using the same port mode allocation as above, the figure above shows that while Bulk Cargo/Container ports handle the largest volume and value of imports, they have the lowest average price per kg across all transport modes. In contrast, air freight—though much smaller in volume—ranks third in overall value, making it the most expensive option per kilogram.
As an importer, this raises important questions. Are you using the best route for your cost per kg? If your cost per kg significantly deviates from the averages, it may be worth assessing whether your logistics are fully optimised. Of course, there are considerations of speed and security of route as well as country of origin to factor in but these averages are a good starting point.
Summary
In conclusion, green tea imports are a significant part of the UK's tea market, with 1.7 million kilograms imported in the first half of this year alone, valued at £14.8 million. These imports come from across the world with different transport modes, such as air freight, RoRo, and bulk cargo, being chosen. Importers must carefully consider the cost per kilogram, speed and security when selecting a route to remain competitive in the market.
Data Source: UK Trade Data
.svg)
.svg)
.webp)
.webp)
.webp)